DataScience Blog
Outlier Analysis - R
January 20, 2021
Please find the Outlier Analysis in R,
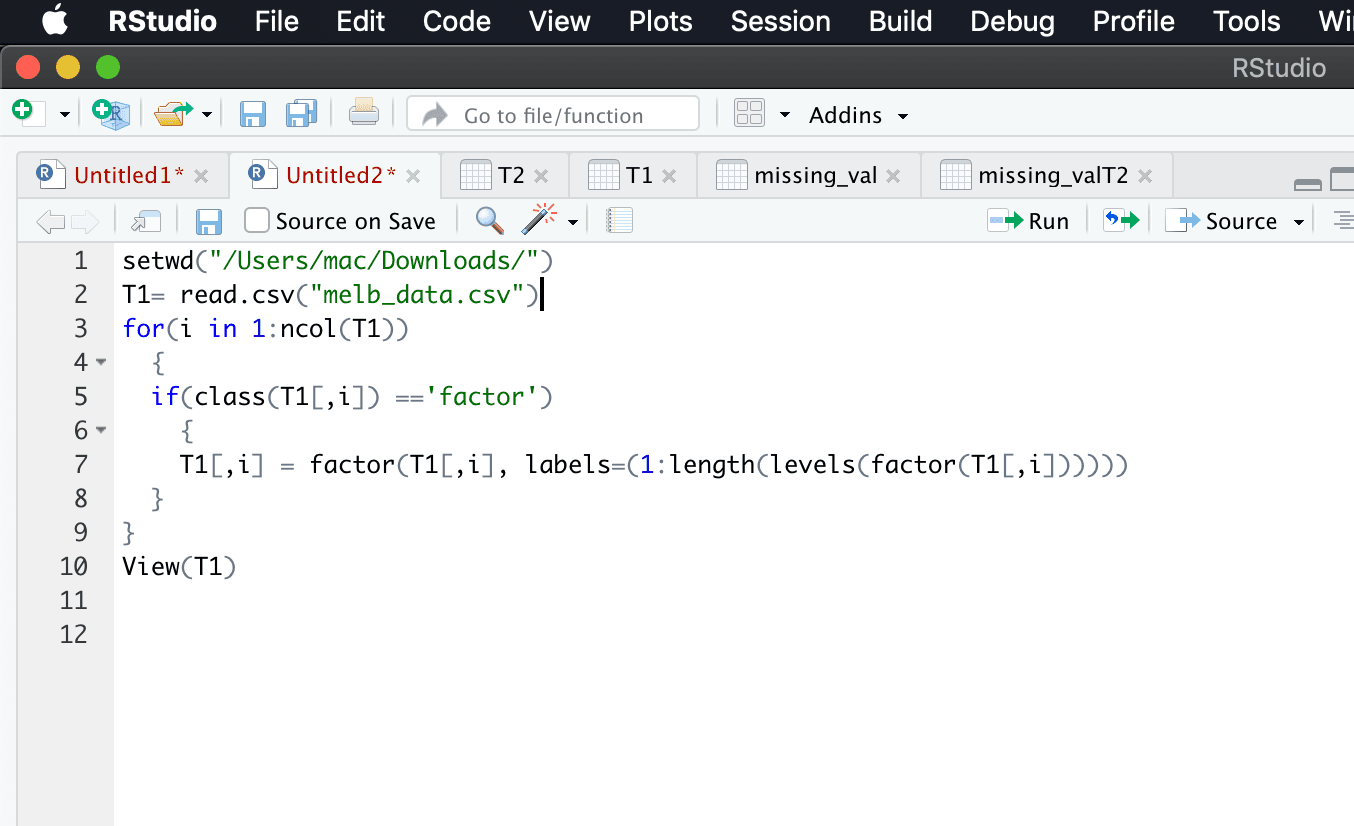
Convert Strings into factor numeric
for(i in 1:ncol(T1))
{
if(class(T1[,i]) ==‘factor’)
{
T1[,i] = factor(T1[,i], labels=(1:length(levels(factor(T1[,i])))))
}
}
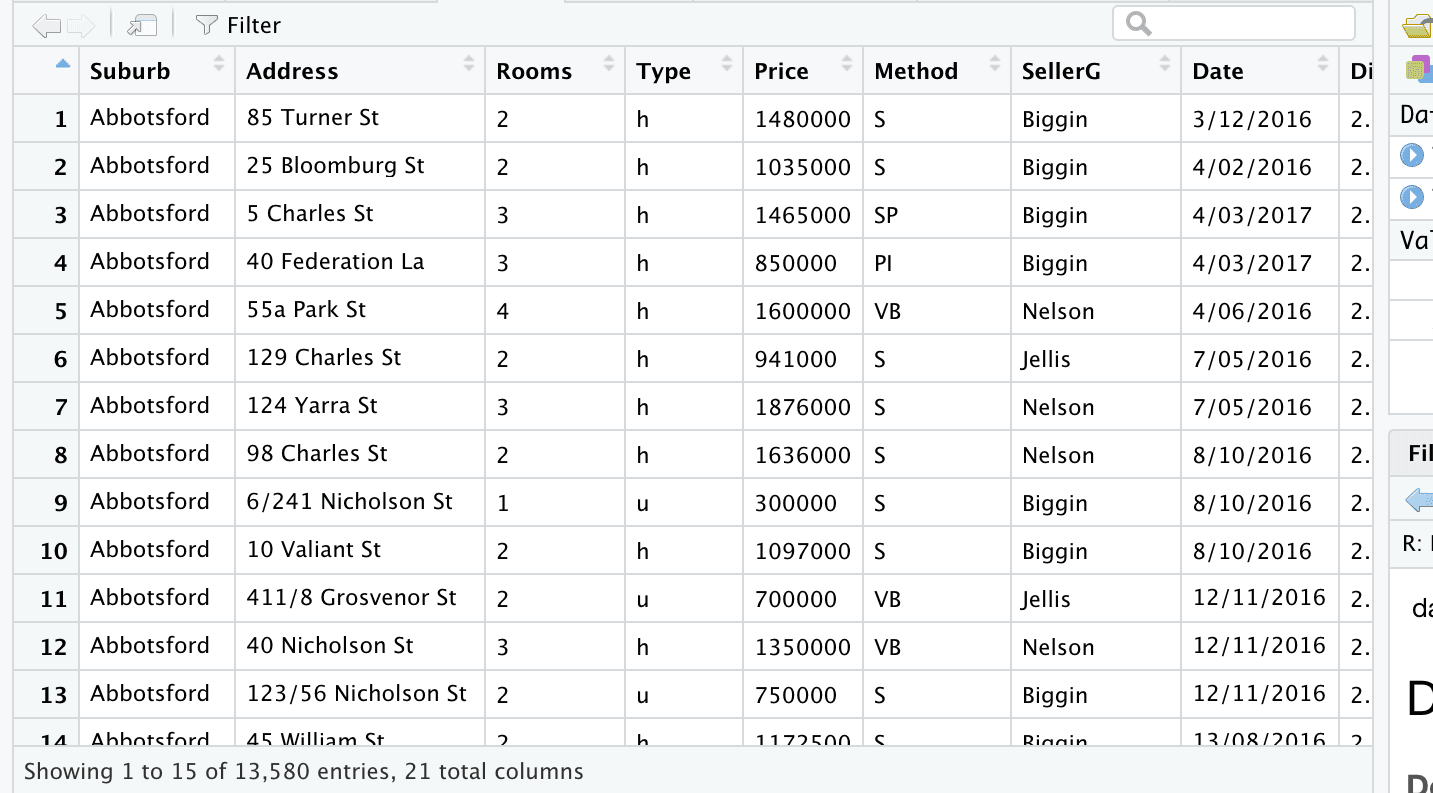
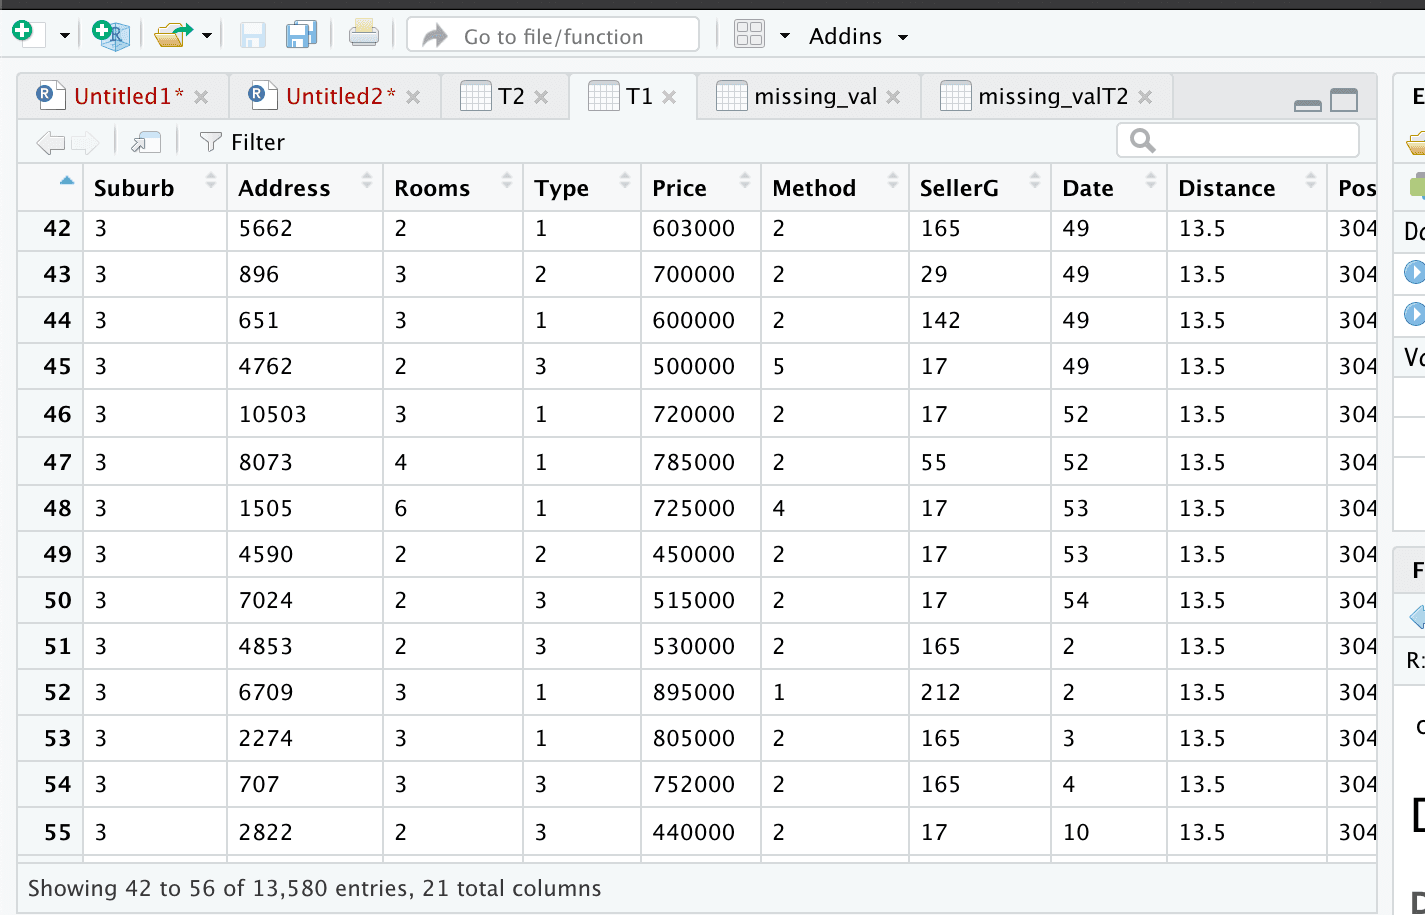
 The original csv file and the file after changing strings to factor numeric is given below to understand the difference better
Outlier Analysis
Boxplots - Distribution and Outlier Check
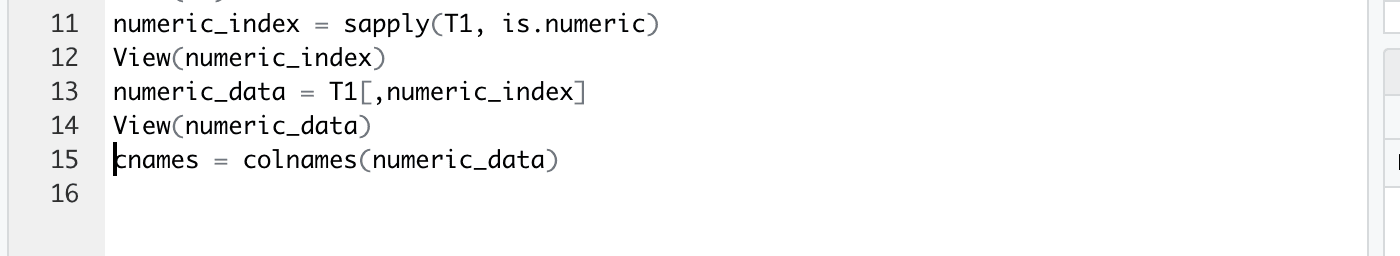
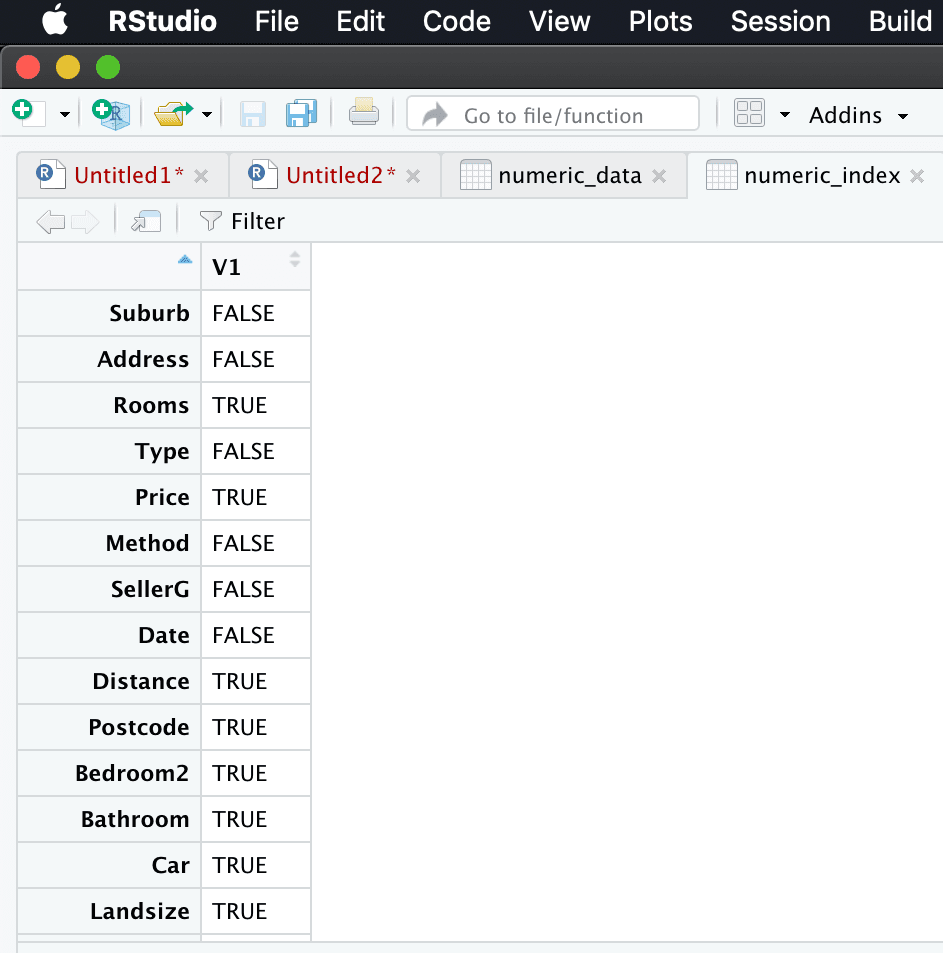
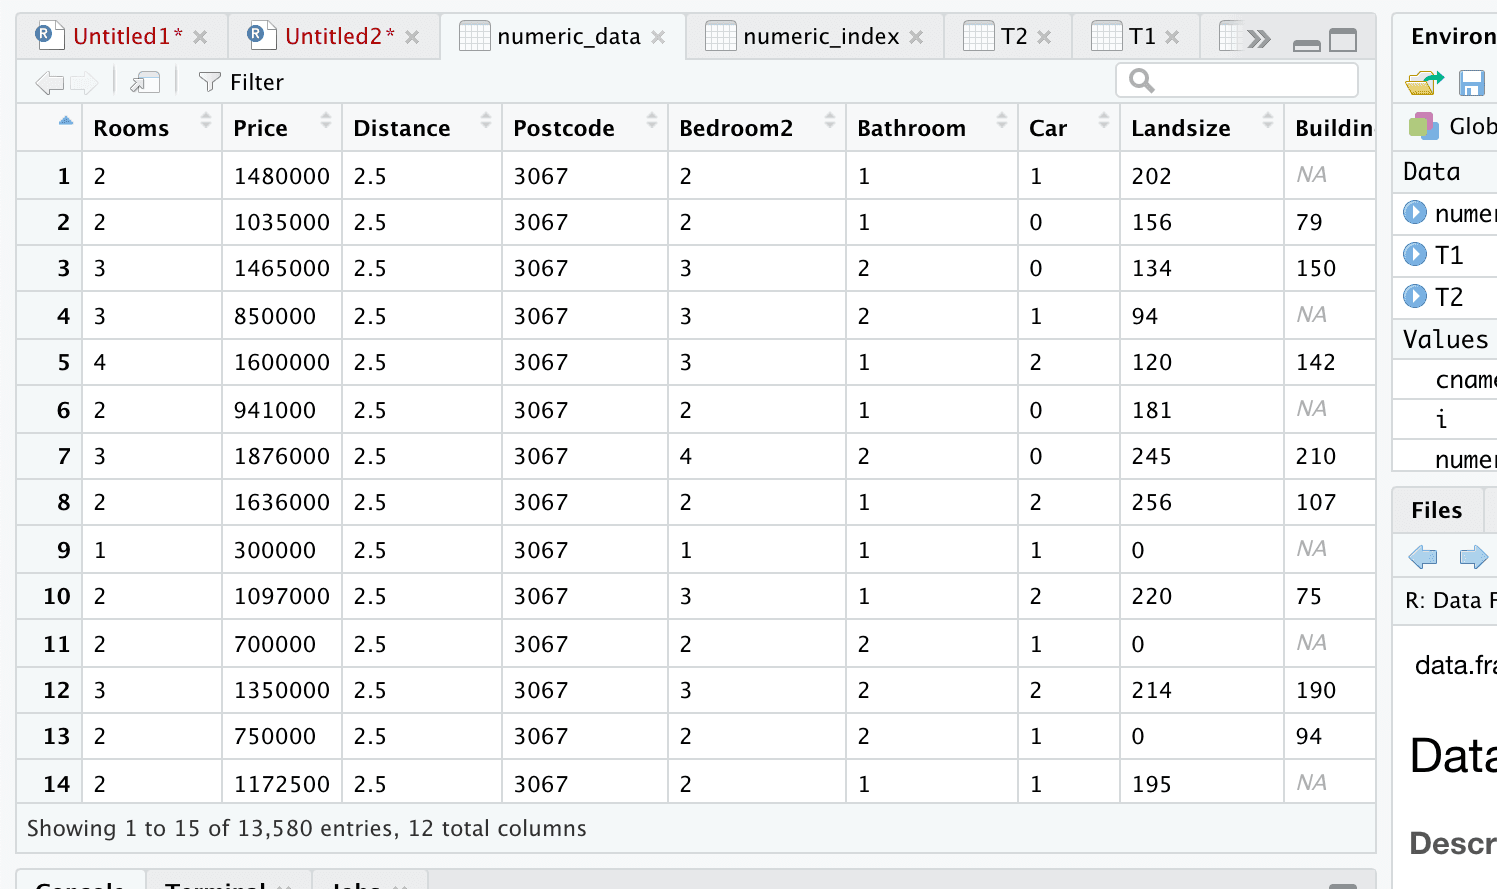
Extracting only numeric variables
numericindex = sapply(T1, is.numeric)
numericdata = T1[,numeric_index]
view(numericindex)
view(numericdata)
cnames = colnames(numericdata)
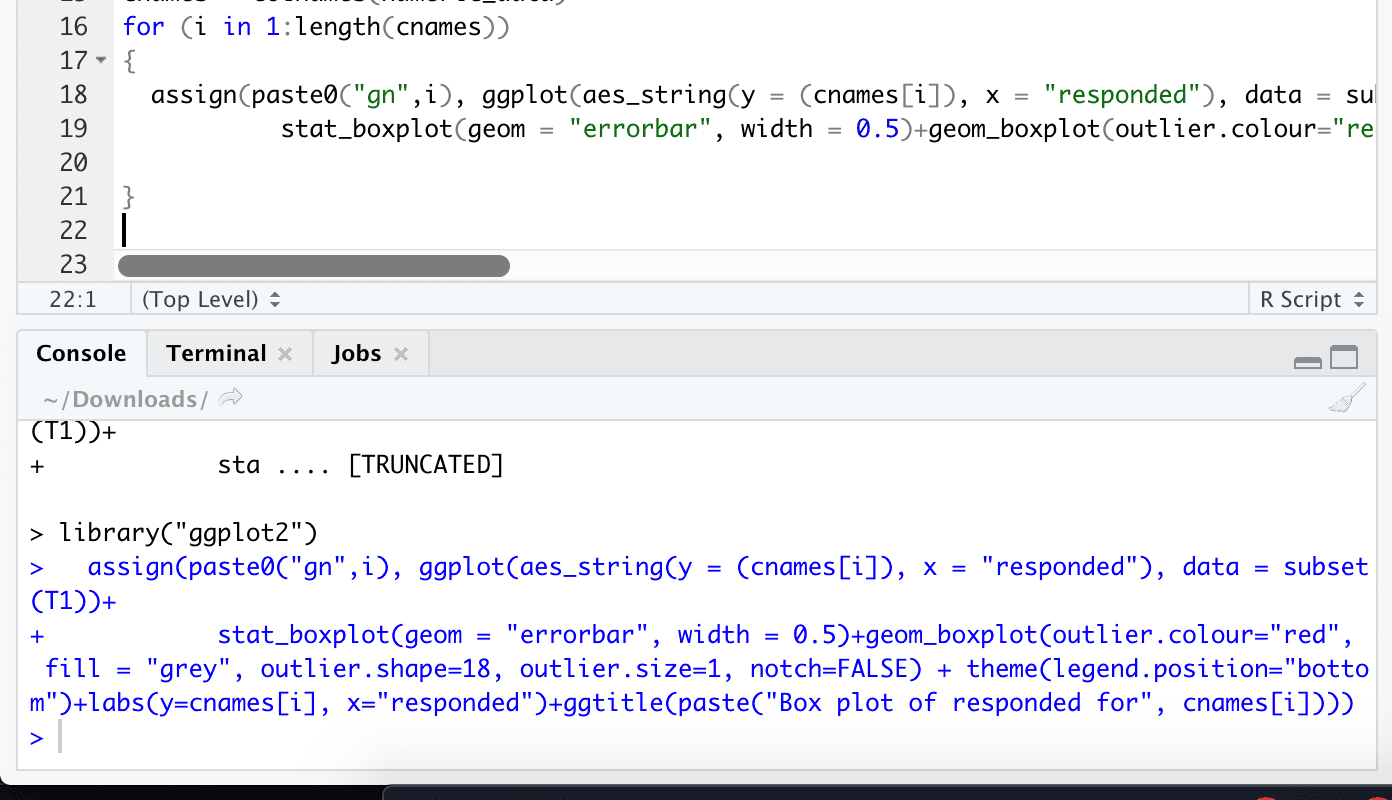
for (i in 1:length(cnames))
{
assign(paste0(“gn”,i), ggplot(aesstring(y = (cnames[i]), x = “responded”), data = subset(T1))+
statboxplot(geom = “errorbar”, width = 0.5)+geomboxplot(outlier.colour=“red”, fill = “grey”, outlier.shape=18, outlier.size=1, notch=FALSE) + theme(legend.position=“bottom”)+labs(y=cnames[i], x=“responded”)+ggtitle(paste(“Box plot of responded for”, cnames[i])))
}
** Note **
If you get an error, could not find function ggplot, please do execute below commands.
install.packages(“ggplot2”)
library(“ggplot2”)
After executing above commands, run the code.
Plotting plots together
gridExtra::grid.arrange(gn1,ncol=1)
Boxplot will look like below
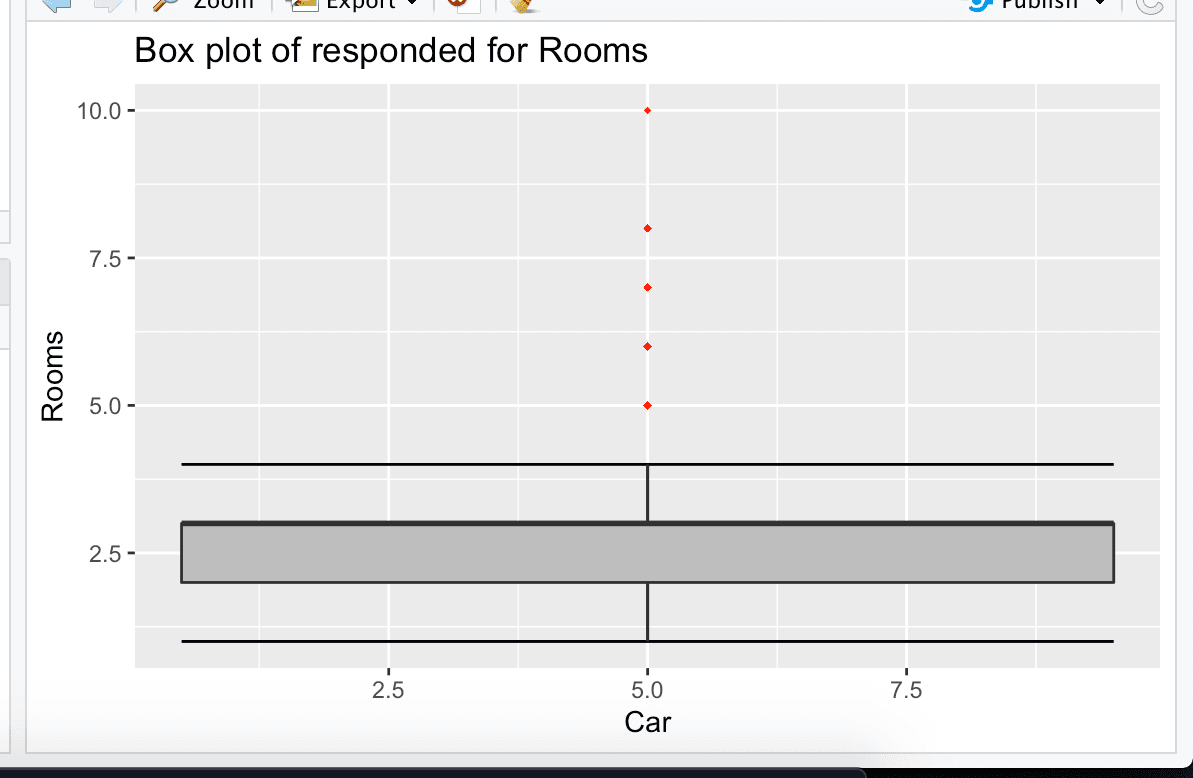
With this we will end up this. The Detailed outlier analysis will be updated later.
Stay Tuned for
-
Feature Selection
-
Feature Scaling
-
Sampling Techniques
And we still have python implementation of all these starts from Missing Value Analysis to Sampling Techniques!!.
sssss!!!! Wait!.. And the real Roller coaster ride starts hereafter. Yes.. Machine Learning!!! Much awaited portion!!!.. stay tuned to learn :)